
BRZEN
Statistical hypothesis test
Texto da Wikipédia (en), licença CC BY-SA. O BETARUBI mostra o verbete inteiro nesta página — a leitura não continua fora do site.
| Test Statistic | Type of Test |
|---|---|
| t-statistic | t-test Regression test |
| F-statistic | ANOVA MANOVA ANCOVA |
| z-statistic | z-test |
| x2-statistic | Chi-square test |
| Some of the most common test statistics and their corresponding statistical tests or models. | |
A statistical hypothesis test is a method of statistical inference used to decide whether the data provide sufficient evidence to reject a particular hypothesis. A statistical hypothesis test typically involves a calculation of a test statistic. Then a decision is made, either by comparing the test statistic to a critical value or equivalently by evaluating a p-value computed from the test statistic. Roughly 100 specialized statistical tests are in use.[1][2]
Definition of terms
The goal of a hypothesis test is to establish whether certain properties of a statistical population are true by examining sample data. Typically, the population is modelled by a random variable whose distribution has unknown parameters. For example, a medical trial may wish to establish whether a particular drug is effective in treating high blood pressure, with "the change in blood pressure observed in a patient who takes the drug" being the random variable. An example hypothesis could be "the mean change in blood pressure is zero" or "the mean change in blood pressure is negative". In general, any statement about the parameters describing a population can be a hypothesis (but not a statement about the sample).[3]
The test compares two hypotheses: a default null hypothesis (denoted H0) and its negation, the alternative hypothesis (H1).[4][5] It is usually consistent with the research hypothesis because it is constructed from literature review, previous studies, etc. However, the research hypothesis is sometimes consistent with the null hypothesis. The null hypothesis and alternative hypothesis are two mutually exclusive statements.
"The statement being tested in a test of statistical significance is called the 'null hypothesis'. The test of significance is designed to assess the strength of the evidence against the null hypothesis. Usually, the null hypothesis is a statement of 'no effect' or 'no difference'."[6]
If the sample data are consistent with the null hypothesis, then you do not reject the null hypothesis; if the sample data are inconsistent with the null hypothesis, then you reject the null hypothesis and conclude that the alternative hypothesis is true.[7]
Typically the test will select a null hypothesis that the intervention being studied has no effect, or that the population parameter takes some "obvious" value. A test statistic is computed from the given sample data, and the tester calculates the conditional probability of observing a value at least this extreme, supposing the null hypothesis is true. If this probability (called the p-value) is less than the significance level of the test (denoted ), then the null hypothesis is rejected. The test does not conclude that the null hypothesis is false, or that the probability that the null hypothesis is false is less than .[8]

Because it is usually impossible to definitely establish whether the hypothesis being tested is true or false from a sample, the conclusion of a hypothesis test is not certain to be correct. There are two possible classes of error:
- A type I error, in which the null hypothesis is rejected despite the null hypothesis being true, with probability . This is the same as the significance level of the test.
- A type II error, in which the null hypothesis is accepted despite the alternative hypothesis being true, with probability . The quantity is called the power of the test.


Some further definitions:
- Simple hypothesis: Any hypothesis which specifies the population distribution completely.
- Composite hypothesis: Any hypothesis which does not specify the population distribution completely.
- Positive data: Data that enable the investigator to reject a null hypothesis.

- Critical values of a statistical test are the boundaries of the acceptance region of the test.[9] The acceptance region is the set of values of the test statistic for which the null hypothesis is not rejected. Depending on the shape of the acceptance region, there can be one or more than one critical value.
- Region of rejection / Critical region: The set of values of the test statistic for which the null hypothesis is rejected.
- Size: For simple hypotheses, this is the test's probability of incorrectly rejecting the null hypothesis. The false positive rate. For composite hypotheses this is the supremum of the probability of rejecting the null hypothesis over all cases covered by the null hypothesis. The complement of the false positive rate is termed specificity in biostatistics. ("This is a specific test. Because the result is positive, we can confidently say that the patient has the condition.") See sensitivity and specificity and type I and type II errors for exhaustive definitions.
- Statistical significance test: A predecessor to the statistical hypothesis test (see the Origins section). An experimental result was said to be statistically significant if a sample was sufficiently inconsistent with the (null) hypothesis. This was variously considered common sense, a pragmatic heuristic for identifying meaningful experimental results, a convention establishing a threshold of statistical evidence or a method for drawing conclusions from data. The statistical hypothesis test added mathematical rigor and philosophical consistency to the concept by making the alternative hypothesis explicit. The term is loosely used for the modern version which is now part of statistical hypothesis testing.
- Conservative test: A test is conservative if, when constructed for a given nominal significance level, the true probability of incorrectly rejecting the null hypothesis is never greater than the nominal level.
- Exact test
In the case of a scalar parameter, there are four principal types of alternative hypothesis:
- Point. Point alternative hypotheses occur when the hypothesis test is framed so that the population distribution under the alternative hypothesis is a fully defined distribution, with no unknown parameters; such hypotheses are usually of no practical interest but are fundamental to theoretical considerations of statistical inference and are the basis of the Neyman–Pearson lemma.
- One-tailed directional. A one-tailed directional alternative hypothesis is concerned with the region of rejection for only one tail of the sampling distribution.
- Two-tailed directional. A two-tailed directional alternative hypothesis is concerned with both regions of rejection of the sampling distribution.
- Non-directional. A non-directional alternative hypothesis is not concerned with either region of rejection; rather, it is only concerned that null hypothesis is not true.
A statistical hypothesis test compares a test statistic (z or t for examples) to a threshold. The test statistic (the formula found in the table below) is based on optimality. For a fixed level of Type I error rate, use of these statistics minimizes Type II error rates (equivalent to maximizing power). The following terms describe tests in terms of such optimality:
- Most powerful test: For a given size or significance level, the test with the greatest power (probability of rejection) for a given value of the parameter(s) being tested, contained in the alternative hypothesis.
- Uniformly most powerful test (UMP)
There are several types of hypothesis:
- Simple hypothesis
- Any hypothesis that specifies the population distribution completely. For such a hypothesis the sampling distribution of any statistic is a function of the sample size alone.
- Composite hypothesis
- Any hypothesis that does not specify the population distribution completely.[10] Example: A hypothesis specifying a normal distribution with a specified mean and an unspecified variance.
The simple/composite distinction was made by Neyman and Pearson.[11]
- Exact hypothesis
- Any hypothesis that specifies an exact parameter value[12] is an exact hypothesis, also known as a point hypothesis. Example: .
- Inexact hypothesis
- Those specifying a parameter range or interval. Examples: ; .


Fisher required an exact null hypothesis for testing (see the quotations below).
History
The history of the null and alternative hypotheses has much to do with the history of statistical tests.[13][14] While hypothesis testing was popularized early in the 20th century, early forms were used in the 1700s. The first use is credited to John Arbuthnot (1710),[15] followed by Pierre-Simon Laplace (1770s), in analyzing the human sex ratio at birth; see § Human sex ratio.
1778: Pierre Laplace compares the birthrates of boys and girls in multiple European cities. He states: "it is natural to conclude that these possibilities are very nearly in the same ratio". Thus, the null hypothesis in this case that the birthrates of boys and girls should be equal given "conventional wisdom".[16]
1900: Karl Pearson develops the chi squared test to determine "whether a given form of frequency curve will effectively describe the samples drawn from a given population." Thus the null hypothesis is that a population is described by some distribution predicted by theory. He uses as an example the numbers of five and sixes in the Weldon dice throw data.[17]
1904: Karl Pearson develops the concept of "contingency" in order to determine whether outcomes are independent of a given categorical factor. Here the null hypothesis is by default that two things are unrelated (e.g. scar formation and death rates from smallpox).[18] The null hypothesis in this case is no longer predicted by theory or conventional wisdom, but is instead the principle of indifference that led Fisher and others to dismiss the use of "inverse probabilities".[19]
The concept of an alternative hypothesis in testing was devised by Jerzy Neyman and Egon Pearson, and it is used in the Neyman–Pearson lemma. It forms a major component in modern statistical hypothesis testing. However it was not part of Ronald Fisher's formulation of statistical hypothesis testing, and he opposed its use.[20] In Fisher's approach to testing, the central idea is to assess whether the observed dataset could have resulted from chance if the null hypothesis were assumed to hold, notionally without preconceptions about what other models might hold.[citation needed] Modern statistical hypothesis testing accommodates this type of test since the alternative hypothesis can be just the negation of the null hypothesis.
Modern origins and early controversy
Modern significance testing is largely the product of Karl Pearson (p-value, Pearson's chi-squared test), William Sealy Gosset (Student's t-distribution), and Ronald Fisher ("null hypothesis", analysis of variance, "significance test"), while hypothesis testing was developed by Jerzy Neyman and Egon Pearson (son of Karl). Ronald Fisher began his life in statistics as a Bayesian (Zabell 1992), but Fisher soon grew disenchanted with the subjectivity involved (namely use of the principle of indifference when determining prior probabilities), and sought to provide a more "objective" approach to inductive inference.[21]
Fisher emphasized rigorous experimental design and methods to extract a result from few samples assuming Gaussian distributions. Neyman (who teamed with the younger Pearson) emphasized mathematical rigor and methods to obtain more results from many samples and a wider range of distributions. Modern hypothesis testing is an inconsistent hybrid of the Fisher vs Neyman/Pearson formulation, methods and terminology developed in the early 20th century.
Fisher popularized the "significance test". He required a null-hypothesis (corresponding to a population frequency distribution) and a sample. His (now familiar) calculations determined whether to reject the null-hypothesis or not. Significance testing did not utilize an alternative hypothesis so there was no concept of a Type II error (false negative).
The p-value was devised as an informal, but objective, index meant to help a researcher determine (based on other knowledge) whether to modify future experiments or strengthen one's faith in the null hypothesis.[22] Hypothesis testing (and Type I/II errors) was devised by Neyman and Pearson as a more objective alternative to Fisher's p-value, also meant to determine researcher behaviour, but without requiring any inductive inference by the researcher.[11][23]
Neyman & Pearson considered a different problem to Fisher (which they called "hypothesis testing"). They initially considered two simple hypotheses (both with frequency distributions). They calculated two probabilities and typically selected the hypothesis associated with the higher probability (the hypothesis more likely to have generated the sample). Their method always selected a hypothesis. It also allowed the calculation of both types of error probabilities. In a series of papers (published over a decade starting in 1928) Neyman & Pearson defined the statistical hypothesis test as a proposed improvement on Fisher's test. The papers provided much of the terminology for statistical tests including alternative hypothesis and H0 as a hypothesis to be tested using observational data (with H1, H2... as alternatives).[11]
Fisher and Neyman/Pearson clashed bitterly. Neyman/Pearson considered their formulation to be an improved generalization of significance testing (the defining paper[11] was abstract; Mathematicians have generalized and refined the theory for decades[24]). Fisher thought that it was not applicable to scientific research because often, during the course of the experiment, it is discovered that the initial assumptions about the null hypothesis are questionable due to unexpected sources of error. He believed that the use of rigid reject/accept decisions based on models formulated before data is collected was incompatible with this common scenario faced by scientists and attempts to apply this method to scientific research would lead to mass confusion.[25]
The dispute between Fisher and Neyman–Pearson was waged on philosophical grounds, characterized by a philosopher as a dispute over the proper role of models in statistical inference.[26]
Fisher published the first edition of the book The Design of Experiments, which introduced the null hypothesis[27] (by example rather than by definition) and carefully explained the rationale for significance tests in the context of the interpretation of experimental results.
Neyman accepted a position in the University of California, Berkeley in 1938, breaking his partnership with Pearson and separating the disputants (who had previously occupied the same building). The dispute between Fisher and Neyman terminated (unresolved after 27 years) with Fisher's death in 1962. Neyman wrote a well-regarded eulogy.[28] Some of Neyman's later publications reported p-values and significance levels.[29]
The subject today combines much of the terminology and explanatory power of Neyman & Pearson with the scientific philosophy and calculations provided by Fisher. Whether statistical testing is properly one subject or two remains a source of disagreement.[30] Sample of two: One text refers to the subject as hypothesis testing (with no mention of significance testing in the index) while another says significance testing (with a section on inference as a decision). Fisher developed significance testing as a flexible tool for researchers to weigh their evidence. Instead testing has become institutionalized. Statistical significance has become a rigidly defined and enforced criterion for the publication of experimental results in many scientific journals. In some fields significance testing has become the dominant and nearly exclusive form of statistical analysis. As a consequence the limitations of the tests have been exhaustively studied. Books have been filled with the collected criticism of significance testing.[citation needed].
Null hypothesis significance testing (NHST)
The modern version of hypothesis testing is generally called the null hypothesis significance testing (NHST)[31] and is a hybrid of the Fisher approach with the Neyman-Pearson approach. In 2000, Raymond S. Nickerson wrote an article stating that NHST was (at the time) "arguably the most widely used method of analysis of data collected in psychological experiments and has been so for about 70 years" and that it was at the same time "very controversial".[31]
This fusion resulted from confusion by writers of statistical textbooks (as predicted by Fisher) beginning in the 1940s[32] (but signal detection, for example, still uses the Neyman/Pearson formulation). Great conceptual differences and many caveats in addition to those mentioned above were ignored. Neyman and Pearson provided the stronger terminology, the more rigorous mathematics and the more consistent philosophy, but the subject taught today in introductory statistics has more similarities with Fisher's method than theirs.[13]
Sometime around 1940,[32] authors of statistical text books began combining the two approaches by using the p-value in place of the test statistic (or data) to test against the Neyman–Pearson "significance level".
| # | Fisher's null hypothesis testing | Neyman–Pearson decision theory |
|---|---|---|
| 1 | Set up a statistical null hypothesis. The null need not be a nil hypothesis (i.e., zero difference). | Set up two statistical hypotheses, H1 and H2, and decide about α, β, and sample size before the experiment, based on subjective cost-benefit considerations. These define a rejection region for each hypothesis. |
| 2 | Report the exact level of significance (e.g. p = 0.051 or p = 0.049). Do not refer to "accepting" or "rejecting" hypotheses. If the result is "not significant", draw no conclusions and make no decisions, but suspend judgement until further data is available. | If the data falls into the rejection region of H1, accept H2; otherwise accept H1. Accepting a hypothesis does not mean that you believe in it, but only that you act as if it were true. |
| 3 | Use this procedure only if little is known about the problem at hand, and only to draw provisional conclusions in the context of an attempt to understand the experimental situation. | The usefulness of the procedure is limited among others to situations where you have a disjunction of hypotheses (e.g. either μ1 = 8 or μ2 = 10 is true) and where you can make meaningful cost-benefit trade-offs for choosing alpha and beta. |
Technical description of the null hypothesis
The null hypothesis is a default hypothesis that a quantity to be measured is zero (null). Typically, the quantity to be measured is the difference between two situations. For instance, trying to determine if there is a positive proof that an effect has occurred or that samples derive from different batches.[33][34]
The null hypothesis is generally assumed to remain possibly true. Multiple analyses can be performed to show how the hypothesis should either be rejected or excluded e.g. having a high confidence level, thus demonstrating a statistically significant difference. This is demonstrated by showing that zero is outside of the specified confidence interval of the measurement on either side, typically within the real numbers.[34] Failure to exclude the null hypothesis (with any confidence) does not logically confirm or support the (unprovable) null hypothesis. (When it is not proven that something is e.g. bigger than x, it does not necessarily imply it is smaller or equal than x; it may instead be a poor quality measurement with low accuracy. Confirming the null hypothesis is two-sided would amount to positively proving it is bigger or equal than 0 and to positively proving it is smaller or equal than 0; this is something for which infinite accuracy is needed as well as exactly zero effect, neither of which normally are realistic. Also, measurements never indicate a non-zero probability of exactly zero difference.) So failure of an exclusion of a null hypothesis amounts to a "don't know" at the specified confidence level; it does not immediately imply null somehow, as the data may already show a (less strong) indication for a non-null. The used confidence level does absolutely certainly not correspond to the likelihood of null at failing to exclude; in fact in this case a high used confidence level expands the still plausible range.
A non-null hypothesis can have the following meanings, depending on the author a) a value other than zero is used, b) some margin other than zero is used and c) the "alternative" hypothesis.[35][36]
Testing (excluding or failing to exclude) the null hypothesis provides evidence that there are (or are not) statistically sufficient grounds to believe there is a relationship between two phenomena (e.g., that a potential treatment has a non-zero effect, either way). Testing the null hypothesis is a central task in statistical hypothesis testing in the modern practice of science. There are precise criteria for excluding or not excluding a null hypothesis at a certain confidence level. The confidence level should indicate the likelihood that much more and better data would still be able to exclude the null hypothesis on the same side.[34]
The concept of a null hypothesis is used differently in two approaches to statistical inference. In the significance testing approach of Ronald Fisher, a null hypothesis is rejected if the observed data are significantly unlikely to have occurred if the null hypothesis were true. In this case, the null hypothesis is rejected and an alternative hypothesis is accepted in its place. If the data are consistent with the null hypothesis statistically possibly true, then the null hypothesis is not rejected. In neither case is the null hypothesis or its alternative proven; with better or more data, the null may still be rejected. This is analogous to the legal principle of presumption of innocence, in which a suspect or defendant is assumed to be innocent (null is not rejected) until proven guilty (null is rejected) beyond a reasonable doubt (to a statistically significant degree).[34]
In the hypothesis testing approach of Jerzy Neyman and Egon Pearson, a null hypothesis is contrasted with an alternative hypothesis, and the two hypotheses are distinguished on the basis of data, with certain error rates. It is used in formulating answers in research.
Statistical inference can be done without a null hypothesis, by specifying a statistical model corresponding to each candidate hypothesis, and by using model selection techniques to choose the most appropriate model.[37] (The most common selection techniques are based on either Akaike information criterion or Bayes factor).
Philosophy
Paul Meehl has argued that the epistemological importance of the choice of null hypothesis has gone largely unacknowledged. When the null hypothesis is predicted by theory, a more precise experiment will be a more severe test of the underlying theory. When the null hypothesis defaults to "no difference" or "no effect", a more precise experiment is a less severe test of the theory that motivated performing the experiment.[38]
Fisher and Neyman opposed the subjectivity of probability. Their views contributed to the objective definitions. The core of their historical disagreement was philosophical.
Many of the philosophical criticisms of hypothesis testing are discussed by statisticians in other contexts, particularly correlation does not imply causation and the design of experiments. Hypothesis testing is of continuing interest to philosophers.[26][39]
Education
Statistics is increasingly being taught in schools with hypothesis testing being one of the elements taught.[40][41] Many conclusions reported in the popular press (political opinion polls to medical studies) are based on statistics. Some writers have stated that statistical analysis of this kind allows for thinking clearly about problems involving mass data, as well as the effective reporting of trends and inferences from said data, but caution that writers for a broad public should have a solid understanding of the field in order to use the terms and concepts correctly.[42][43] An introductory college statistics class places much emphasis on hypothesis testing – perhaps half of the course. Such fields as literature and divinity now include findings based on statistical analysis (see the Bible Analyzer). An introductory statistics class teaches hypothesis testing as a cookbook process. Hypothesis testing is also taught at the postgraduate level. Statisticians learn how to create good statistical test procedures (like z, Student's t, F and chi-squared). Statistical hypothesis testing is considered a mature area within statistics,[44] but a limited amount of development continues.
An academic study states that the cookbook method of teaching introductory statistics leaves no time for history, philosophy or controversy. Hypothesis testing has been taught as received unified method. Surveys showed that graduates of the class were filled with philosophical misconceptions (on all aspects of statistical inference) that persisted among instructors.[45] While the problem was addressed more than a decade ago,[46] and calls for educational reform continue,[47] students still graduate from statistics classes holding fundamental misconceptions about hypothesis testing.[48] Ideas for improving the teaching of hypothesis testing include encouraging students to search for statistical errors in published papers, teaching the history of statistics and emphasizing the controversy in a generally dry subject.[49]
Raymond S. Nickerson commented:
The debate about NHST has its roots in unresolved disagreements among major contributors to the development of theories of inferential statistics on which modern approaches are based. Gigerenzer et al. (1989) have reviewed in considerable detail the controversy between R. A. Fisher on the one hand and Jerzy Neyman and Egon Pearson on the other as well as the disagreements between both of these views and those of the followers of Thomas Bayes. They noted the remarkable fact that little hint of the historical and ongoing controversy is to be found in most textbooks that are used to teach NHST to its potential users. The resulting lack of an accurate historical perspective and understanding of the complexity and sometimes controversial philosophical foundations of various approaches to statistical inference may go a long way toward explaining the apparent ease with which statistical tests are misused and misinterpreted.[31]
Principle
Hypothesis testing requires constructing a statistical model of what the data would look like if chance or random processes alone were responsible for the results. The hypothesis that chance alone is responsible for the results is called the null hypothesis. The model of the result of the random process is called the distribution under the null hypothesis. The obtained results are compared with the distribution under the null hypothesis, and the likelihood of finding the obtained results is thereby determined.[50]
Hypothesis testing works by collecting data and measuring how likely the particular set of data is (assuming the null hypothesis is true), when the study is on a randomly selected representative sample. The null hypothesis assumes no relationship between variables in the population from which the sample is selected.[51]
If the data-set of a randomly selected representative sample is very unlikely relative to the null hypothesis (defined as being part of a class of sets of data that are rarely observed), the experimenter rejects the null hypothesis, concluding it (probably) is false. This class of data-sets is usually specified via a test statistic, which is designed to measure the extent of apparent departure from the null hypothesis. The procedure works by assessing whether the observed departure, measured by the test statistic, is larger than a value defined, so that the probability of occurrence of a more extreme value is small under the null hypothesis (usually in less than either 5% or 1% of similar data-sets in which the null hypothesis does hold).
If the data do not contradict the null hypothesis, then only a weak conclusion can be made: namely, that the observed data set provides insufficient evidence against the null hypothesis. In this case, because the null hypothesis could be true or false, in some contexts this is interpreted as meaning that the data give insufficient evidence to make any conclusion, while in other contexts, it is interpreted as meaning that there is not sufficient evidence to support changing from a currently useful regime to a different one. Nevertheless, if at this point the effect appears likely and/or large enough, there may be an incentive to further investigate, such as running a bigger sample.
For instance, a certain drug may reduce the risk of having a heart attack. Possible null hypotheses are "this drug does not reduce the risk of having a heart attack" or "this drug has no effect on the risk of having a heart attack". The test of the hypothesis consists of administering the drug to half of the people in a study group as a controlled experiment. If the data show a statistically significant change in the people receiving the drug, the null hypothesis is rejected.
Goals of null hypothesis tests
There are many types of significance tests for one, two or more samples, for means, variances and proportions, paired or unpaired data, for different distributions, for large and small samples; all have null hypotheses. There are also at least four goals of null hypotheses for significance tests:[52]
- Technical null hypotheses are used to verify statistical assumptions. For example, the residuals between the data and a statistical model cannot be distinguished from random noise. If true, there is no justification for complicating the model.
- Scientific null assumptions are used to directly advance a theory. For example, the angular momentum of the universe is zero. If not true, the theory of the early universe may need revision.
- Null hypotheses of homogeneity are used to verify that multiple experiments are producing consistent results. For example, the effect of a medication on the elderly is consistent with that of the general adult population. If true, this strengthens the general effectiveness conclusion and simplifies recommendations for use.
- Null hypotheses that assert the equality of effect of two or more alternative treatments, for example, a drug and a placebo, are used to reduce scientific claims based on statistical noise. This is the most popular null hypothesis; It is so popular that many statements about significant testing assume such null hypotheses.
Rejection of the null hypothesis is not necessarily the real goal of a significance tester. An adequate statistical model may be associated with a failure to reject the null; the model is adjusted until the null is not rejected. The numerous uses of significance testing were well known to Fisher who discussed many in his book written a decade before defining the null hypothesis.[53]
A statistical significance test shares much mathematics with a confidence interval. They are mutually illuminating. A result is often significant when there is confidence in the sign of a relationship (the interval does not include 0). Whenever the sign of a relationship is important, statistical significance is a worthy goal. This also reveals weaknesses of significance testing: A result can be significant without a good estimate of the strength of a relationship; significance can be a modest goal. A weak relationship can also achieve significance with enough data. Reporting both significance and confidence intervals is commonly recommended.
The varied uses of significance tests reduce the number of generalizations that can be made about all applications.
Choice of the null hypothesis
The choice of the null hypothesis is associated with sparse and inconsistent advice. Fisher mentioned few constraints on the choice and stated that many null hypotheses should be considered and that many tests are possible for each. The variety of applications and the diversity of goals suggests that the choice can be complicated. In many applications the formulation of the test is traditional. A familiarity with the range of tests available may suggest a particular null hypothesis and test. Formulating the null hypothesis is not automated (though the calculations of significance testing usually are). David Cox said, "How [the] translation from subject-matter problem to statistical model is done is often the most critical part of an analysis".[54]
A statistical significance test is intended to test a hypothesis. If the hypothesis summarizes a set of data, there is no value in testing the hypothesis on that set of data. Example: If a study of last year's weather reports indicates that rain in a region falls primarily on weekends, it is only valid to test that null hypothesis on weather reports from any other year. Testing hypotheses suggested by the data is circular reasoning that proves nothing; It is a special limitation on the choice of the null hypothesis.
A routine procedure is as follows: Start from the scientific hypothesis. Translate this to a statistical alternative hypothesis and proceed: "Because Ha expresses the effect that we wish to find evidence for, we often begin with Ha and then set up H0 as the statement that the hoped-for effect is not present."[6] This advice is reversed for modeling applications where we hope not to find evidence against the null.
A complex case example is as follows:[55] The gold standard in clinical research is the randomized placebo-controlled double-blind clinical trial. But testing a new drug against a (medically ineffective) placebo may be unethical for a serious illness. Testing a new drug against an older medically effective drug raises fundamental philosophical issues regarding the goal of the test and the motivation of the experimenters. The standard "no difference" null hypothesis may reward the pharmaceutical company for gathering inadequate data. "Difference" is a better null hypothesis in this case, but statistical significance is not an adequate criterion for reaching a nuanced conclusion that requires a good numeric estimate of the drug's effectiveness. A "minor" or "simple" proposed change in the null hypothesis ((new vs old) rather than (new vs placebo)) can have a dramatic effect on the utility of a test for complex non-statistical reasons.
Directionality
The choice of null hypothesis (H0) and consideration of directionality (see "one-tailed test") is critical.
Tailedness of the null-hypothesis test
Consider the question of whether a tossed coin is fair (i.e. that on average it lands heads up 50% of the time) and an experiment where you toss the coin 5 times. A possible result of the experiment that we consider here is 5 heads. Let outcomes be considered unlikely with respect to an assumed distribution if their probability is lower than a significance threshold of 0.05.
A potential null hypothesis implying a one-tailed test is "this coin is not biased toward heads". Beware that, in this context, the term "one-tailed" does not refer to the outcome of a single coin toss (i.e., whether or not the coin comes up "tails" instead of "heads"); the term "one-tailed" refers to a specific way of testing the null hypothesis in which the critical region (also known as "region of rejection") ends up in on only one side of the probability distribution.
Indeed, with a fair coin the probability of this experiment outcome is 1/25 = 0.031, which would be even lower if the coin were biased in favour of tails. Therefore, the observations are not likely enough for the null hypothesis to hold, and the test refutes it. Since the coin is ostensibly neither fair nor biased toward tails, the conclusion of the experiment is that the coin is biased toward heads.
Alternatively, a null hypothesis implying a two-tailed test is "this coin is fair". This one null hypothesis could be examined by looking out for either too many tails or too many heads in the experiments. The outcomes that would tend to refute this null hypothesis are those with a large number of heads or a large number of tails, and our experiment with 5 heads would seem to belong to this class.
However, the probability of 5 tosses of the same kind, irrespective of whether these are head or tails, is twice as much as that of the 5-head occurrence singly considered. Hence, under this two-tailed null hypothesis, the observation receives a probability value of 0.063. Hence again, with the same significance threshold used for the one-tailed test (0.05), the same outcome is not statistically significant. Therefore, the two-tailed null hypothesis is preserved in this case, not supporting the conclusion reached with the single-tailed null hypothesis, that the coin is biased toward heads.
This example illustrates that the conclusion reached from a statistical test may depend on the precise formulation of the null and alternative hypotheses.
Discussion
Fisher said, "the null hypothesis must be exact, that is free of vagueness and ambiguity, because it must supply the basis of the 'problem of distribution,' of which the test of significance is the solution", implying a more restrictive domain for H0.[56] According to this view, the null hypothesis must be numerically exact—it must state that a particular quantity or difference is equal to a particular number. In classical science, it is most typically the statement that there is no effect of a particular treatment; in observations, it is typically that there is no difference between the value of a particular measured variable and that of a prediction.
Most statisticians believe that it is valid to state direction as a part of null hypothesis, or as part of a null hypothesis/alternative hypothesis pair.[57] However, the results are not a full description of all the results of an experiment, merely a single result tailored to one particular purpose. For example, consider an H0 that claims the population mean for a new treatment is an improvement on a well-established treatment with population mean = 10 (known from long experience), with the one-tailed alternative being that the new treatment's mean > 10. If the sample evidence obtained through x-bar equals −200 and the corresponding t-test statistic equals −50, the conclusion from the test would be that there is no evidence that the new treatment is better than the existing one: it would not report that it is markedly worse, but that is not what this particular test is looking for. To overcome any possible ambiguity in reporting the result of the test of a null hypothesis, it is best to indicate whether the test was two-sided and, if one-sided, to include the direction of the effect being tested.
The statistical theory required to deal with the simple cases of directionality dealt with here, and more complicated ones, makes use of the concept of an unbiased test.
The directionality of hypotheses is not always obvious. The explicit null hypothesis of Fisher's Lady tasting tea example was that the Lady had no such ability, which led to a symmetric probability distribution. The one-tailed nature of the test resulted from the one-tailed alternate hypothesis (a term not used by Fisher). The null hypothesis became implicitly one-tailed. The logical negation of the Lady's one-tailed claim was also one-tailed. (Claim: Ability > 0; Stated null: Ability = 0; Implicit null: Ability ≤ 0).
Pure arguments over the use of one-tailed tests are complicated by the variety of tests. Some tests (for instance the χ2 goodness of fit test) are inherently one-tailed. Some probability distributions are asymmetric. The traditional tests of 3 or more groups are two-tailed.
Advice concerning the use of one-tailed hypotheses has been inconsistent and accepted practice varies among fields.[58] The greatest objection to one-tailed hypotheses is their potential subjectivity. A non-significant result can sometimes be converted to a significant result by the use of a one-tailed hypothesis (as the fair coin test, at the whim of the analyst). The flip side of the argument: One-sided tests are less likely to ignore a real effect. One-tailed tests can suppress the publication of data that differs in sign from predictions. Objectivity was a goal of the developers of statistical tests.
It is a common practice to use a one-tailed hypothesis by default. However, "If you do not have a specific direction firmly in mind in advance, use a two-sided alternative. Moreover, some users of statistics argue that we should always work with the two-sided alternative."[6][59]
One alternative to this advice is to use three-outcome tests. It eliminates the issues surrounding directionality of hypotheses by testing twice, once in each direction and combining the results to produce three possible outcomes.[60] Variations on this approach have a history, being suggested perhaps 10 times since 1950.[61]
Disagreements over one-tailed tests flow from the philosophy of science. While Fisher was willing to ignore the unlikely case of the Lady guessing all cups of tea incorrectly (which may have been appropriate for the circumstances), medicine believes that a proposed treatment that kills patients is significant in every sense and should be reported and perhaps explained. Poor statistical reporting practices have contributed to disagreements over one-tailed tests. Statistical significance resulting from two-tailed tests is insensitive to the sign of the relationship; Reporting significance alone is inadequate. "The treatment has an effect" is the uninformative result of a two-tailed test. "The treatment has a beneficial effect" is the more informative result of a one-tailed test. "The treatment has an effect, reducing the average length of hospitalization by 1.5 days" is the most informative report, combining a two-tailed significance test result with a numeric estimate of the relationship between treatment and effect. Explicitly reporting a numeric result eliminates a philosophical advantage of a one-tailed test. An underlying issue is the appropriate form of an experimental science without numeric predictive theories: A model of numeric results is more informative than a model of effect signs (positive, negative or unknown), which is more informative than a model of simple significance (non-zero or unknown); in the absence of numeric theory signs may suffice.
Performing a frequentist hypothesis test in practice
The typical steps involved in performing a frequentist hypothesis test in practice are:
- Define a hypothesis (claim which is testable using data).
- Select a relevant statistical test with associated test statistic T.
- Derive the distribution of the test statistic under the null hypothesis from the assumptions. In standard cases this will be a well-known result. For example, the test statistic might follow a Student's t distribution with known degrees of freedom, or a normal distribution with known mean and variance.
- Select a significance level (α), the maximum acceptable false positive rate. Common values are 5% and 1%.
- Compute from the observations the observed value tobs of the test statistic T.
- Decide to either reject the null hypothesis in favor of the alternative or not reject it. The Neyman-Pearson decision rule is to reject the null hypothesis H0 if the observed value tobs is in the critical region, and not to reject the null hypothesis otherwise.[62]
Practical example
The difference in the two processes applied to the radioactive suitcase example (below):
- "The Geiger-counter reading is 10. The limit is 9. Check the suitcase."
- "The Geiger-counter reading is high; 97% of safe suitcases have lower readings. The limit is 95%. Check the suitcase."
The former report is adequate, the latter gives a more detailed explanation of the data and the reason why the suitcase is being checked.
Not rejecting the null hypothesis does not mean the null hypothesis is "accepted" per se (though Neyman and Pearson used that word in their original writings; see the Interpretation section).
The processes described here are perfectly adequate for computation. They seriously neglect the design of experiments considerations.[63][64]
It is particularly critical that appropriate sample sizes be estimated before conducting the experiment.
The phrase "test of significance" was coined by statistician Ronald Fisher.[65]
Interpretation
When the null hypothesis is true and statistical assumptions are met, the probability that the p-value will be less than or equal to the significance level is at most . This ensures that the hypothesis test maintains its specified false positive rate (provided that statistical assumptions are met).[3]
The p-value is the probability that a test statistic which is at least as extreme as the one obtained would occur under the null hypothesis. At a significance level of 0.05, a fair coin would be expected to (incorrectly) reject the null hypothesis (that it is fair) in 1 out of 20 tests on average. The p-value does not provide the probability that either the null hypothesis or its opposite is correct (a common source of confusion).[66]
If the p-value is less than the chosen significance threshold (equivalently, if the observed test statistic is in the critical region), then we say the null hypothesis is rejected at the chosen level of significance. If the p-value is not less than the chosen significance threshold (equivalently, if the observed test statistic is outside the critical region), then the null hypothesis is not rejected at the chosen level of significance.
In the "lady tasting tea" example (below), Fisher required the lady to properly categorize all of the cups of tea to justify the conclusion that the result was unlikely to result from chance. His test revealed that if the lady was effectively guessing at random (the null hypothesis), there was a 1.4% chance that the observed results (perfectly ordered tea) would occur.
Use and importance
Statistics are helpful in analyzing most collections of data. This is equally true of hypothesis testing which can justify conclusions even when no scientific theory exists. In the Lady tasting tea example, it was "obvious" that no difference existed between (milk poured into tea) and (tea poured into milk). The data contradicted the "obvious".
Real world applications of hypothesis testing include:[67]
- Testing whether more men than women suffer from nightmares
- Establishing authorship of documents
- Evaluating the effect of the full moon on behavior
- Determining the range at which a bat can detect an insect by echo
- Deciding whether hospital carpeting results in more infections
- Selecting the best means to stop smoking
- Checking whether bumper stickers reflect car owner behavior
- Testing the claims of handwriting analysts
Statistical hypothesis testing plays an important role in the whole of statistics and in statistical inference. For example, Lehmann (1992) in a review of the fundamental paper by Neyman and Pearson (1933) says: "Nevertheless, despite their shortcomings, the new paradigm formulated in the 1933 paper, and the many developments carried out within its framework continue to play a central role in both the theory and practice of statistics and can be expected to do so in the foreseeable future".
Significance testing has been the favored statistical tool in some experimental social sciences (over 90% of articles in the Journal of Applied Psychology during the early 1990s).[68] Other fields have favored the estimation of parameters (e.g. effect size). Significance testing is used as a substitute for the traditional comparison of predicted value and experimental result at the core of the scientific method. When theory is only capable of predicting the sign of a relationship, a directional (one-sided) hypothesis test can be configured so that only a statistically significant result supports theory. This form of theory appraisal is the most heavily criticized application of hypothesis testing.
Cautions
"If the government required statistical procedures to carry warning labels like those on drugs, most inference methods would have long labels indeed."[6] This caution applies to hypothesis tests and alternatives to them.
The successful hypothesis test is associated with a probability and a type-I error rate. The conclusion might be wrong.
The conclusion of the test is only as solid as the sample upon which it is based. The design of the experiment is critical. A number of unexpected effects have been observed including:
- The clever Hans effect. A horse appeared to be capable of doing simple arithmetic.
- The Hawthorne effect. Industrial workers were more productive in better illumination, and most productive in worse.
- The placebo effect. Pills with no medically active ingredients were remarkably effective.
A statistical analysis of misleading data produces misleading conclusions. The issue of data quality can be more subtle. In forecasting for example, there is no agreement on a measure of forecast accuracy. In the absence of a consensus measurement, no decision based on measurements will be without controversy.
Publication bias: Statistically nonsignificant results may be less likely to be published, which can bias the literature.
Multiple testing: When multiple true null hypothesis tests are conducted at once without adjustment, the overall probability of Type I error is higher than the nominal alpha level.[69]
Those making critical decisions based on the results of a hypothesis test are prudent to look at the details rather than the conclusion alone. In the physical sciences most results are fully accepted only when independently confirmed.
Nonparametric bootstrap hypothesis testing
Bootstrap-based resampling methods can be used for null hypothesis testing. A bootstrap creates numerous simulated samples by randomly resampling (with replacement) the original, combined sample data, assuming the null hypothesis is correct. The bootstrap is very versatile as it is distribution-free and it does not rely on restrictive parametric assumptions, but rather on empirical approximate methods with asymptotic guarantees. Traditional parametric hypothesis tests are more computationally efficient but make stronger structural assumptions. In situations where computing the probability of the test statistic under the null hypothesis is hard or impossible (due to perhaps inconvenience or lack of knowledge of the underlying distribution), the bootstrap offers a viable method for statistical inference.[70][71][72][73]
Examples
Human sex ratio
The earliest use of statistical hypothesis testing is generally credited to the question of whether male and female births are equally likely (null hypothesis), which was addressed in the 1700s by John Arbuthnot (1710),[74] and later by Pierre-Simon Laplace (1770s).[75]
Arbuthnot examined birth records in London for each of the 82 years from 1629 to 1710, and applied the sign test, a simple non-parametric test.[76][77][78] In every year, the number of males born in London exceeded the number of females. Considering more male or more female births as equally likely, the probability of the observed outcome is 0.582, or about 1 in 4,836,000,000,000,000,000,000,000; in modern terms, this is the p-value. Arbuthnot concluded that this is too small to be due to chance and must instead be due to divine providence: "From whence it follows, that it is Art, not Chance, that governs." In modern terms, he rejected the null hypothesis of equally likely male and female births at the p = 1/282 significance level.
Laplace considered the statistics of almost half a million births. The statistics showed an excess of boys compared to girls.[16] He concluded by calculation of a p-value that the excess was a real, but unexplained, effect.[79]
Lady tasting tea
In a famous example of hypothesis testing, known as the Lady tasting tea,[80] Dr. Muriel Bristol, a colleague of Fisher, claimed to be able to tell whether the tea or the milk was added first to a cup. Fisher proposed to give her eight cups, four of each variety, in random order. One could then ask what the probability was for her getting the number she got correct, but just by chance. The null hypothesis was that the Lady had no such ability. The test statistic was a simple count of the number of successes in selecting the four cups. The critical region was the single case of 4 successes of 4 possible based on a conventional probability criterion (< 5%). A pattern of 4 successes corresponds to 1 out of 70 possible combinations (p≈ 1.4%). Fisher asserted that no alternative hypothesis was (ever) required. The lady correctly identified every cup,[81] which would be considered a statistically significant result.
Clairvoyant card game
A person (the subject) is tested for clairvoyance. They are shown the back face of a randomly chosen playing card 25 times and asked which of the four suits it belongs to. The number of hits, or correct answers, is called X.
As we try to find evidence of their clairvoyance, for the time being the null hypothesis is that the person is not clairvoyant.[82] The alternative is: the person is (more or less) clairvoyant.
If the null hypothesis is valid, the only thing the test person can do is guess. For every card, the probability (relative frequency) of any single suit appearing is 1/4. If the alternative is valid, the test subject will predict the suit correctly with probability greater than 1/4. We will call the probability of guessing correctly p. The hypotheses, then, are:
- null hypothesis (just guessing)
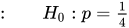
and
- alternative hypothesis (true clairvoyant).

When the test subject correctly predicts all 25 cards, we will consider them clairvoyant, and reject the null hypothesis. Thus also with 24 or 23 hits. With only 5 or 6 hits, on the other hand, there is no cause to consider them so. But what about 12 hits, or 17 hits? What is the critical number, c, of hits, at which point we consider the subject to be clairvoyant? How do we determine the critical value c? With the choice c=25 (i.e. we only accept clairvoyance when all cards are predicted correctly) we're more critical than with c=10. In the first case almost no test subjects will be recognized to be clairvoyant, in the second case, a certain number will pass the test. In practice, one decides how critical one will be. That is, one decides how often one accepts an error of the first kind – a false positive, or Type I error. With c = 25 the probability of such an error is:
- ,

and hence, very small. The probability of a false positive is the probability of randomly guessing correctly all 25 times.
Being less critical, with c = 10, gives:
- .

Thus, c = 10 yields a much greater probability of false positive.
Before the test is actually performed, the maximum acceptable probability of a Type I error (α) is determined. Typically, values in the range of 1% to 5% are selected. (If the maximum acceptable error rate is zero, an infinite number of correct guesses is required.) Depending on this Type 1 error rate, the critical value c is calculated. For example, if we select an error rate of 1%, c is calculated thus:
- .

From all the numbers c, with this property, we choose the smallest, in order to minimize the probability of a Type II error, a false negative. For the above example, we select: .

Other examples
One example is where water quality in a stream has been observed over many years, and a test is made of the null hypothesis that "there is no change in quality between the first and second halves of the data", against the alternative hypothesis that "the quality is poorer in the second half of the record".
If the statistical hypothesis testing is thought of as a judgement in a court trial, the null hypothesis corresponds to the position of the defendant (the defendant is innocent) while the alternative hypothesis is in the rival position of prosecutor (the defendant is guilty). The defendant is innocent until proven guilty, so likewise in a hypothesis test, the null hypothesis is initially presumed to be true. To prove the statement of the prosecutor, evidence must be convincing enough to convict the defendant; this is analogous to sufficient statistical significance in a hypothesis test.
In the court, only legal evidence can be considered as the foundation for the trial. As for hypothesis testing, a reasonable test statistic should be set to measure the statistic significance of the null hypothesis. Evidence would support the alternative hypothesis if the null hypothesis is rejected at a certain significance level. However, this does not necessarily mean that the alternative hypothesis is true due to the potential presence of a type I error. In order to quantify the statistical significance, the test statistic variables are assumed to follow a certain probability distribution such as the normal distribution or t-distribution to determine the probability of obtaining test results at least as extreme as the results actually observed, under the assumption that the null hypothesis is correct, which is defined as the p-value.[83][84] If the p-value is smaller than the chosen significance level (α), it can be claimed that observed data is sufficiently inconsistent with the null hypothesis and hence the null hypothesis may be rejected. After testing, a valid claim would be "at the significance level of (α), the null hypothesis is rejected, supporting the alternative hypothesis instead". In the metaphor of a trial, the announcement may be "with tolerance for the probability α of an incorrect conviction, the defendant is guilty."
Variations and sub-classes
Statistical hypothesis testing is a key technique of both frequentist inference and Bayesian inference, although the two types of inference have notable differences. Statistical hypothesis tests define a procedure that controls (fixes) the probability of incorrectly deciding that a default position (null hypothesis) is incorrect. The procedure is based on how likely it would be for a set of observations to occur if the null hypothesis were true. This probability of making an incorrect decision is not the probability that the null hypothesis is true, nor whether any specific alternative hypothesis is true. This contrasts with other possible techniques of decision theory in which the null and alternative hypothesis are treated on a more equal basis.
One naïve Bayesian approach to hypothesis testing is to base decisions on the posterior probability,[85][86] but this fails when comparing point and continuous hypotheses. Other approaches to decision making, such as Bayesian decision theory, attempt to balance the consequences of incorrect decisions across all possibilities, rather than concentrating on a single null hypothesis. A number of other approaches to reaching a decision based on data are available via decision theory and optimal decisions, some of which have desirable properties. Hypothesis testing, though, is a dominant approach to data analysis in many fields of science. Extensions to the theory of hypothesis testing include the study of the power of tests, i.e. the probability of correctly rejecting the null hypothesis given that it is false. Such considerations can be used for the purpose of sample size determination prior to the collection of data.
Neyman–Pearson hypothesis testing
An example of Neyman–Pearson hypothesis testing (or null hypothesis statistical significance testing) can be made by a change to the radioactive suitcase example. If the "suitcase" is actually a shielded container for the transportation of radioactive material, then a test might be used to select among three hypotheses: no radioactive source present, one present, two (all) present. The test could be required for safety, with actions required in each case. The Neyman–Pearson lemma of hypothesis testing says that a good criterion for the selection of hypotheses is the ratio of their probabilities (a likelihood ratio). A simple method of solution is to select the hypothesis with the highest probability for the Geiger counts observed. The typical result matches intuition: few counts imply no source, many counts imply two sources and intermediate counts imply one source. Notice also that usually there are problems for proving a negative. Null hypotheses should be at least falsifiable.
Neyman–Pearson theory can accommodate both prior probabilities and the costs of actions resulting from decisions.[87] The former allows each test to consider the results of earlier tests (unlike Fisher's significance tests). The latter allows the consideration of economic issues (for example) as well as probabilities. A likelihood ratio remains a good criterion for selecting among hypotheses.
The two forms of hypothesis testing are based on different problem formulations. The original test is analogous to a true/false question; the Neyman–Pearson test is more like multiple choice. In the view of Tukey[88] the former produces a conclusion on the basis of only strong evidence while the latter produces a decision on the basis of available evidence. While the two tests seem quite different both mathematically and philosophically, later developments lead to the opposite claim. Consider many tiny radioactive sources. The hypotheses become 0,1,2,3... grains of radioactive sand. There is little distinction between none or some radiation (Fisher) and 0 grains of radioactive sand versus all of the alternatives (Neyman–Pearson). The major Neyman–Pearson paper of 1933[11] also considered composite hypotheses (ones whose distribution includes an unknown parameter). An example proved the optimality of the (Student's) t-test, "there can be no better test for the hypothesis under consideration" (p 321). Neyman–Pearson theory was proving the optimality of Fisherian methods from its inception.
Fisher's significance testing has proven a popular flexible statistical tool in application with little mathematical growth potential. Neyman–Pearson hypothesis testing is claimed as a pillar of mathematical statistics,[89] creating a new paradigm for the field. It also stimulated new applications in statistical process control, detection theory, decision theory and game theory. Both formulations have been successful, but the successes have been of a different character.
The dispute over formulations is unresolved. Science primarily uses Fisher's (slightly modified) formulation as taught in introductory statistics. Statisticians study Neyman–Pearson theory in graduate school. Mathematicians are proud of uniting the formulations. Philosophers consider them separately. Learned opinions deem the formulations variously competitive (Fisher vs Neyman), incompatible[21] or complementary.[24] The dispute has become more complex since Bayesian inference has achieved respectability.
The terminology is inconsistent. Hypothesis testing can mean any mixture of two formulations that both changed with time. Any discussion of significance testing vs hypothesis testing is doubly vulnerable to confusion.
Fisher thought that hypothesis testing was a useful strategy for performing industrial quality control, however, he strongly disagreed that hypothesis testing could be useful for scientists.[22] Hypothesis testing provides a means of finding test statistics used in significance testing.[24] The concept of power is useful in explaining the consequences of adjusting the significance level and is heavily used in sample size determination. The two methods remain philosophically distinct.[26] They usually (but not always) produce the same mathematical answer. The preferred answer is context dependent.[24] While the existing merger of Fisher and Neyman–Pearson theories has been heavily criticized, modifying the merger to achieve Bayesian goals has been considered.[90]
Criticism
Much of the criticisms of statistical hypothesis testing can be summarized by the following issues:
- The interpretation of a p-value is dependent upon stopping rule and definition of multiple comparison. The former often changes during the course of a study and the latter is unavoidably ambiguous. (i.e. "p values depend on both the (data) observed and on the other possible (data) that might have been observed but weren't").[91]
- Confusion resulting (in part) from combining the methods of Fisher and Neyman–Pearson which are conceptually distinct.[88]
- Emphasis on statistical significance to the exclusion of estimation and confirmation by repeated experiments.[92]
- Rigidly requiring statistical significance as a criterion for publication, resulting in publication bias.[93] Most of the criticism is indirect. Rather than being wrong, statistical hypothesis testing is misunderstood, overused and misused.
- When used to detect whether a difference exists between groups, a paradox arises. As improvements are made to experimental design (e.g. increased precision of measurement and sample size), the test becomes more lenient. Unless one accepts the absurd assumption that all sources of noise in the data cancel out completely, the chance of finding statistical significance in either direction approaches 100%.[94] However, this absurd assumption that the mean difference between two groups cannot be zero implies that the data cannot be independent and identically distributed (i.i.d.) because the expected difference between any two subgroups of i.i.d. random variates is zero; therefore, the i.i.d. assumption is also absurd.
- Layers of philosophical concerns. The probability of statistical significance is a function of decisions made by experimenters/analysts.[95] If the decisions are based on convention they are termed arbitrary or mindless[96] while those not so based may be termed subjective. To minimize type II errors, large samples are recommended. In psychology practically all null hypotheses are claimed to be false for sufficiently large samples so "...it is usually nonsensical to perform an experiment with the sole aim of rejecting the null hypothesis."[97] "Statistically significant findings are often misleading" in psychology.[98] Statistical significance does not imply practical significance, and correlation does not imply causation. Casting doubt on the null hypothesis is thus far from directly supporting the research hypothesis.
- "[I]t does not tell us what we want to know".[99] Lists of dozens of complaints are available.[100][31][101]
Critics and supporters are largely in factual agreement regarding the characteristics of null hypothesis significance testing (NHST): While it can provide critical information, it is inadequate as the sole tool for statistical analysis. Successfully rejecting the null hypothesis may offer no support for the research hypothesis. The continuing controversy concerns the selection of the best statistical practices for the near-term future given the existing practices. However, adequate research design can minimize this issue. Critics would prefer to ban NHST completely, forcing a complete departure from those practices,[102] while supporters suggest a less absolute change.[103]
Controversy over significance testing, and its effects on publication bias in particular, has produced several results. The American Psychological Association has strengthened its statistical reporting requirements after review,[104] medical journal publishers have recognized the obligation to publish some results that are not statistically significant to combat publication bias,[105] and a journal (Journal of Articles in Support of the Null Hypothesis) has been created to publish such results exclusively.[106] Textbooks have added some cautions,[107] and increased coverage of the tools necessary to estimate the size of the sample required to produce significant results. Few major organizations have abandoned use of significance tests although some have discussed doing so.[104] For instance, in 2023, the editors of the Journal of Physiology "strongly recommend the use of estimation methods for those publishing in The Journal" (meaning the magnitude of the effect size (to allow readers to judge whether a finding has practical, physiological, or clinical relevance) and confidence intervals to convey the precision of that estimate), saying "Ultimately, it is the physiological importance of the data that those publishing in The Journal of Physiology should be most concerned with, rather than the statistical significance."[108]
P-values are random variables.[109] Therefore, the decision of a statistical test is a random variable; to understand its stability, approaches including the following have been proposed:
- Bootstrapping the sampling distribution of the p-values[110]
Alternatives
A unifying position of critics is that statistics should not lead to an accept-reject conclusion or decision, but to an estimated value with an interval estimate; this data-analysis philosophy is broadly referred to as estimation statistics. Estimation statistics can be accomplished with either frequentist[111] or Bayesian methods.[112][113]
Critics of significance testing have advocated basing inference less on p-values and more on confidence intervals for effect sizes for importance, prediction intervals for confidence, replications and extensions for replicability, meta-analyses for generality :.[114] But none of these suggested alternatives inherently produces a decision. Lehmann said that hypothesis testing theory can be presented in terms of conclusions/decisions, probabilities, or confidence intervals: "The distinction between the ... approaches is largely one of reporting and interpretation."[44]
Bayesian inference is one proposed alternative to significance testing. (Nickerson cited 10 sources suggesting it, including Rozeboom (1960)).[31] For example, Bayesian parameter estimation can provide rich information about the data from which researchers can draw inferences, while using uncertain priors that exert only minimal influence on the results when enough data is available. Psychologist John K. Kruschke has suggested Bayesian estimation as an alternative for the t-test[112] and has also contrasted Bayesian estimation for assessing null values with Bayesian model comparison for hypothesis testing.[113] Two competing models/hypotheses can be compared using Bayes factors.[115] Bayesian methods could be criticized for requiring information that is seldom available in the cases where significance testing is most heavily used. Neither the prior probabilities nor the probability distribution of the test statistic under the alternative hypothesis are often available in the social sciences.[31]
Advocates of a Bayesian approach sometimes claim that the goal of a researcher is most often to objectively assess the probability that a hypothesis is true based on the data they have collected.[116][117] Neither Fisher's significance testing, nor Neyman–Pearson hypothesis testing can provide this information, and do not claim to. The probability a hypothesis is true can only be derived from use of Bayes' Theorem, which was unsatisfactory to both the Fisher and Neyman–Pearson camps due to the explicit use of subjectivity in the form of the prior probability.[11][118] Fisher's strategy is to sidestep this with the p-value (an objective index based on the data alone) followed by inductive inference, while Neyman–Pearson devised their approach of inductive behaviour.
See also

- Statistics
- Almost sure hypothesis testing
- Akaike information criterion
- Bayes factor – Ratio of competing statistical models
- Bayesian information criterion
- Behrens–Fisher problem
- Bootstrapping (statistics)
- Burden of proof – Obligation on a party in a dispute to provide sufficient warrant for their position
- Checking if a coin is fair
- Comparing means test decision tree
- Complete spatial randomness
- Counternull
- Dichotomous thinking
- E-values
- Estimation statistics – Data analysis approach in frequentist statistics
- Falsifiability
- Fisher's method for combining independent tests of significance
- Granger causality
- Likelihood-ratio test – Statistical test that compares goodness of fit
- Look-elsewhere effect
- Modifiable areal unit problem
- Modifiable temporal unit problem
- Multivariate hypothesis testing
- Omnibus test
- Presumption of innocence – Legal principle that one is presumed innocent until proven guilty
- P-value – Function of the observed sample results
References
- ↑ Lewis, Nancy D.; Lewis, Nigel Da Costa; Lewis, N. D. (2013). 100 Statistical Tests in R: What to Choose, how to Easily Calculate, with Over 300 Illustrations and Examples. Heather Hills Press. ISBN 978-1-4840-5299-0.
- ↑ Kanji, Gopal K. (18 July 2006). 100 Statistical Tests. SAGE. ISBN 978-1-4462-2250-8.
- 1 2 Lehmann, E. L.; Romano, Joseph P. (2005). Testing Statistical Hypotheses (3E ed.). New York: Springer. ISBN 978-0-387-98864-1.
- ↑ Carlos Cortinhas; Ken Black (23 September 2014). Statistics for Business and Economics. Wiley. p. 314. ISBN 978-1-119-94335-8.
- ↑ Helmenstine, Anne Marie. "What Is the Null Hypothesis? Definition and Examples". ThoughtCo. Retrieved 10 April 2025.
- 1 2 3 4 Moore, David; McCabe, George (2003). Introduction to the Practice of Statistics (4 ed.). New York: W.H. Freeman and Co. p. 438. ISBN 978-0716796572.
- ↑ Weiss, Neil A. (1999). Introductory Statistics (5th ed.). Addison Wesley. p. 494. ISBN 978-0201598773.
- ↑ Wasserstein RL, Lazar NA (2016). "The ASA's statement on p-values: context, process, and purpose" (PDF). The American Statistician. 70 (2): 129–133. doi:10.1080/00031305.2016.1154108. S2CID 124084622.
- ↑ Hughes, Ann J.; Grawoig, Dennis E. (1971). Statistics: A Foundation for Analysis. Reading, Mass.: Addison-Wesley. p. 191. ISBN 0-201-03021-7.
- ↑ Rossi, R. J. (2018), Mathematical Statistics, Wiley, p. 281.
- 1 2 3 4 5 6 Neyman, J; Pearson, E. S. (January 1, 1933). "On the Problem of the most Efficient Tests of Statistical Hypotheses". Philosophical Transactions of the Royal Society A. 231 (694–706): 289–337. Bibcode:1933RSPTA.231..289N. doi:10.1098/rsta.1933.0009.
- ↑ Winkler, Robert L; Hays, William L (1975). Statistics : probability, inference, and decision. New York: Holt, Rinehart and Winston. p. 403. ISBN 978-0-03-014011-2.
- 1 2 Gigerenzer, Gerd; Zeno Swijtink; Theodore Porter; Lorraine Daston; John Beatty; Lorenz Kruger (1989). "Part 3: The Inference Experts". The Empire of Chance: How Probability Changed Science and Everyday Life. Cambridge University Press. pp. 70–122. ISBN 978-0-521-39838-1.
- ↑ Lehmann, E. L. (2011). Fisher, Neyman, and the creation of classical statistics. New York: Springer. ISBN 978-1441994998.
- ↑ Bellhouse, P. (2001), "John Arbuthnot", in Statisticians of the Centuries by C.C. Heyde and E. Seneta, Springer, pp. 39–42, ISBN 978-0-387-95329-8
- 1 2 Laplace, P. (1778). "Mémoire sur les probabilités". Mémoires de l'Académie Royale des Sciences de Paris: 227–332. Reprinted in Laplace, P. (1878–1912). "Mémoire sur les probabilités (XIX, XX)". Oeuvres complètes de Laplace. Vol. 9. Gauthier-Villars. pp. 383–488. English translation: Laplace, P. (August 21, 2010). "Mémoire sur les probabilités" (PDF). Translated by Pulskam, Richard J. Archived from the original (PDF) on April 27, 2015.
- ↑ Pearson, K (1900). "On the criterion that a given system of deviations from the probable in the case of a correlated system of variables is such that it can be reasonably supposed to have arisen from random sampling" (PDF). The London, Edinburgh, and Dublin Philosophical Magazine and Journal of Science. 5 (50): 157–175. doi:10.1080/14786440009463897.
- ↑ Pearson, K (1904). "On the Theory of Contingency and Its Relation to Association and Normal Correlation". Drapers' Company Research Memoirs Biometric Series. 1: 1–35.
- ↑ Zabell, S (1989). "R. A. Fisher on the History of Inverse Probability". Statistical Science. 4 (3): 247–256. doi:10.1214/ss/1177012488. JSTOR 2245634.
- ↑ Cohen, J. (1990). "Things I have learned (so far)". American Psychologist. 45 (12): 1304–1312. doi:10.1037/0003-066X.45.12.1304. S2CID 7180431.
- 1 2 Raymond Hubbard, M. J. Bayarri, P Values are not Error Probabilities Archived September 4, 2013, at the Wayback Machine. A working paper that explains the difference between Fisher's evidential p-value and the Neyman–Pearson Type I error rate .
- 1 2 Fisher, R (1955). "Statistical Methods and Scientific Induction" (PDF). Journal of the Royal Statistical Society, Series B. 17 (1): 69–78. doi:10.1111/j.2517-6161.1955.tb00180.x.
- ↑ Goodman, S N (June 15, 1999). "Toward evidence-based medical statistics. 1: The P Value Fallacy". Ann Intern Med. 130 (12): 995–1004. doi:10.7326/0003-4819-130-12-199906150-00008. PMID 10383371. S2CID 7534212.
- 1 2 3 4 Lehmann, E. L. (December 1993). "The Fisher, Neyman–Pearson Theories of Testing Hypotheses: One Theory or Two?". Journal of the American Statistical Association. 88 (424): 1242–1249. Bibcode:1993JASA...88.1242L. doi:10.1080/01621459.1993.10476404.
- ↑ Fisher, R N (1958). "The Nature of Probability" (PDF). Centennial Review. 2: 261–274.
We are quite in danger of sending highly trained and highly intelligent young men out into the world with tables of erroneous numbers under their arms, and with a dense fog in the place where their brains ought to be. In this century, of course, they will be working on guided missiles and advising the medical profession on the control of disease, and there is no limit to the extent to which they could impede every sort of national effort.
- 1 2 3 Lenhard, Johannes (2006). "Models and Statistical Inference: The Controversy between Fisher and Neyman–Pearson". Br. J. Philos. Sci. 57: 69–91. doi:10.1093/bjps/axi152. S2CID 14136146.
- ↑ Aldrich, John. "Earliest Known Uses of Some of the Words of Probability & Statistics". Retrieved 30 June 2014. Last update 12 March 2003. From Jeff Miller.
- ↑ Neyman, Jerzy (1967). "RA Fisher (1890—1962): An Appreciation". Science. 156 (3781): 1456–1460. Bibcode:1967Sci...156.1456N. doi:10.1126/science.156.3781.1456. PMID 17741062. S2CID 44708120.
- ↑ Losavich, J. L.; Neyman, J.; Scott, E. L.; Wells, M. A. (1971). "Hypothetical explanations of the negative apparent effects of cloud seeding in the Whitetop Experiment". Proceedings of the National Academy of Sciences of the United States of America. 68 (11): 2643–2646. Bibcode:1971PNAS...68.2643L. doi:10.1073/pnas.68.11.2643. PMC 389491. PMID 16591951.
- ↑ Lehmann, E. L. (December 1993). "The Fisher, Neyman-Pearson Theories of Testing Hypotheses: One Theory or Two?". Journal of the American Statistical Association. 88 (424): 1242–1249. Bibcode:1993JASA...88.1242L. doi:10.1080/01621459.1993.10476404.
- 1 2 3 4 5 6 Nickerson, Raymond S. (2000). "Null Hypothesis Significance Tests: A Review of an Old and Continuing Controversy" (PDF). Psychological Methods. 5 (2): 241–301. doi:10.1037/1082-989X.5.2.241. PMID 10937333. S2CID 28340967. Archived from the original on 2000-02-23.
- 1 2 Halpin, P F; Stam, HJ (Winter 2006). "Inductive Inference or Inductive Behavior: Fisher and Neyman: Pearson Approaches to Statistical Testing in Psychological Research (1940–1960)". The American Journal of Psychology. 119 (4): 625–653. doi:10.2307/20445367. JSTOR 20445367. PMID 17286092.
- ↑ Everitt, Brian (1998). The Cambridge Dictionary of Statistics. Cambridge and New York: Cambridge University Press. ISBN 978-0521593465.
- 1 2 3 4 Hayes, Adam. "Null Hypothesis Definition". Investopedia. Retrieved 10 December 2019.
- ↑ Zhao, Guolong (18 April 2015). "A Test of Non Null Hypothesis for Linear Trends in Proportions". Communications in Statistics – Theory and Methods. 44 (8): 1621–1639. doi:10.1080/03610926.2013.776687. ISSN 0361-0926. S2CID 120030713.
- ↑ "OECD Glossary of Statistical Terms – Non-null hypothesis Definition". stats.oecd.org. Retrieved 5 December 2020.
- ↑ Burnham, K. P.; Anderson, D. R. (2002), Model Selection and Multimodel Inference: A Practical Information-Theoretic Approach (2nd ed.), Springer-Verlag, ISBN 978-0-387-95364-9.
- ↑ Meehl, P (1990). "Appraising and Amending Theories: The Strategy of Lakatosian Defense and Two Principles That Warrant It" (PDF). Psychological Inquiry. 1 (2): 108–141. doi:10.1207/s15327965pli0102_1.
- ↑ Mayo, D. G.; Spanos, A. (2006). "Severe Testing as a Basic Concept in a Neyman–Pearson Philosophy of Induction". The British Journal for the Philosophy of Science. 57 (2): 323–357. doi:10.1093/bjps/axl003. S2CID 7176653.
- ↑ Mathematics > High School: Statistics & Probability > Introduction Deprecated link archived July 28, 2012, at archive.today Common Core State Standards Initiative (relates to USA students)
- ↑ College Board Tests > AP: Subjects > Statistics The College Board (relates to USA students)
- ↑ Huff, Darrell (1993). How to lie with statistics. New York: Norton. p. 8. ISBN 978-0-393-31072-6.'Statistical methods and statistical terms are necessary in reporting the mass data of social and economic trends, business conditions, "opinion" polls, the census. But without writers who use the words with honesty and readers who know what they mean, the result can only be semantic nonsense.'
- ↑ Snedecor, George W.; Cochran, William G. (1967). Statistical Methods (6 ed.). Ames, Iowa: Iowa State University Press. p. 3. "...the basic ideas in statistics assist us in thinking clearly about the problem, provide some guidance about the conditions that must be satisfied if sound inferences are to be made, and enable us to detect many inferences that have no good logical foundation."
- 1 2 E. L. Lehmann (1997). "Testing Statistical Hypotheses: The Story of a Book". Statistical Science. 12 (1): 48–52. doi:10.1214/ss/1029963261.
- ↑ Sotos, Ana Elisa Castro; Vanhoof, Stijn; Noortgate, Wim Van den; Onghena, Patrick (2007). "Students' Misconceptions of Statistical Inference: A Review of the Empirical Evidence from Research on Statistics Education" (PDF). Educational Research Review. 2 (2): 98–113. doi:10.1016/j.edurev.2007.04.001.
- ↑ Moore, David S. (1997). "New Pedagogy and New Content: The Case of Statistics" (PDF). International Statistical Review. 65 (2): 123–165. doi:10.2307/1403333. JSTOR 1403333.
- ↑ Hubbard, Raymond; Armstrong, J. Scott (2006). "Why We Don't Really Know What Statistical Significance Means: Implications for Educators". Journal of Marketing Education. 28 (2): 114–120. doi:10.1177/0273475306288399. hdl:2092/413. S2CID 34729227.
- ↑ Sotos, Ana Elisa Castro; Vanhoof, Stijn; Noortgate, Wim Van den; Onghena, Patrick (2009). "How Confident Are Students in Their Misconceptions about Hypothesis Tests?". Journal of Statistics Education. 17 (2). doi:10.1080/10691898.2009.11889514.
- ↑ Gigerenzer, G. (2004). "The Null Ritual What You Always Wanted to Know About Significant Testing but Were Afraid to Ask" (PDF). The SAGE Handbook of Quantitative Methodology for the Social Sciences. pp. 391–408. doi:10.4135/9781412986311. ISBN 978-0-7619-2359-6.
- ↑ Stockburger D.W. (2007), "Hypothesis and hypothesis testing", Encyclopedia of Measurement and Statistics (editor—Salkind N.J.), SAGE Publications.
- ↑ Chiang, I. -Chant A.; Jhangiani, Rajiv S.; Price, Paul C. (13 October 2015). "Understanding Null Hypothesis Testing – Research Methods in Psychology". opentextbc.ca. Retrieved 10 December 2019.
- ↑ Cox, DR (1982). "Statistical Significance Tests". Br. J. Clin. Pharmacol. 14 (3): 325–331. doi:10.1111/j.1365-2125.1982.tb01987.x. PMC 1427620. PMID 6751362.
- ↑ Statistical Methods for Research Workers (11th Ed): Chapter IV: Tests of Goodness of Fit, Independence and Homogeneity; With Table of χ2. Regarding a significance test supporting goodness of fit: If the calculated probability is high then "there is certainly no reason to suspect that the [null] hypothesis is tested. If it is [low] it is strongly indicated that the [null] hypothesis fails to account for the whole of the facts."
- ↑ Cox, D. R. (2006). Principles of Statistical Inference. Cambridge University Press. p. 197. ISBN 978-0-521-68567-2.
- ↑ Jones, B; P Jarvis; J A Lewis; A F Ebbutt (6 July 1996). "Trials to assess equivalence: the importance of rigorous methods". BMJ. 313 (7048): 36–39. doi:10.1136/bmj.313.7048.36. PMC 2351444. PMID 8664772. It is suggested that the default position (the null hypothesis) should be that the treatments are not equivalent. Conclusions should be made on the basis of confidence intervals rather than significance.
- ↑ Fisher, R. A. (1966). The Design of Experiments (8th ed.). Edinburgh: Hafner.
- ↑ For example see Null hypothesis
- ↑ Lombardi, Celia M.; Hurlbert, Stuart H. (2009). "Misprescription and misuse of one-tailed tests". Austral Ecology. 34 (4): 447–468. Bibcode:2009AusEc..34..447L. doi:10.1111/j.1442-9993.2009.01946.x. Discusses the merits and historical usage of one-tailed tests in biology at length.
- ↑ Bland, J Martin; Altman, Douglas G (23 July 1994). "One and two sided tests of significance". BMJ. 309 (6949): 248. doi:10.1136/bmj.309.6949.248. PMC 2540725. PMID 8069143. With respect to medical statistics: "In general a one sided test is appropriate when a large difference in one direction would lead to the same action as no difference at all. Expectation of a difference in a particular direction is not adequate justification." "Two sided tests should be used unless there is a very good reason for doing otherwise. If one sided tests are to be used the direction of the test must be specified in advance. One sided tests should never be used simply as a device to make a conventionally non-significant difference significant."
- ↑ Jones, Lyle V.; Tukey, John W. (2000). "A Sensible Formulation of the Significance Test". Psychological Methods. 5 (4): 411–414. doi:10.1037/1082-989X.5.4.411. PMID 11194204. S2CID 14553341. Test results are signed: significant positive effect, significant negative effect or insignificant effect of unknown sign. This is a more nuanced conclusion than that of the two-tailed test. It has the advantages of one-tailed tests without the disadvantages.
- ↑ Hurlbert, S. H.; Lombardi, C. M. (2009). "Final collapse of the Neyman-Pearson decision theoretic framework and rise of the neoFisherian". Ann. Zool. Fennici. 46 (5): 311–349. doi:10.5735/086.046.0501. ISSN 1797-2450. S2CID 9688067.
- ↑ "Testing Statistical Hypotheses". Springer Texts in Statistics. 2005. doi:10.1007/0-387-27605-x. ISBN 978-0-387-98864-1. ISSN 1431-875X.
{{cite journal}}: CS1 maint: periodical has ISBN (link) - ↑ Hinkelmann, Klaus; Kempthorne, Oscar (2008). Design and Analysis of Experiments. Vol. I and II (Second ed.). Wiley. ISBN 978-0-470-38551-7.
- ↑ Montgomery, Douglas (2009). Design and analysis of experiments. Hoboken, N.J.: Wiley. ISBN 978-0-470-12866-4.
- ↑ R. A. Fisher (1925).Statistical Methods for Research Workers, Edinburgh: Oliver and Boyd, 1925, p.43.
- ↑ Nuzzo, Regina (2014). "Scientific method: Statistical errors". Nature. 506 (7487): 150–152. Bibcode:2014Natur.506..150N. doi:10.1038/506150a. hdl:11573/685222. PMID 24522584.
- ↑ Richard J. Larsen; Donna Fox Stroup (1976). Statistics in the Real World: a book of examples. Macmillan. ISBN 978-0-02-367720-5.
- ↑ Hubbard, R.; Parsa, A. R.; Luthy, M. R. (1997). "The Spread of Statistical Significance Testing in Psychology: The Case of the Journal of Applied Psychology". Theory and Psychology. 7 (4): 545–554. doi:10.1177/0959354397074006. S2CID 145576828.
- ↑ Ranganathan, Priya; Pramesh, C. S; Buyse, Marc (April–June 2016). "Common pitfalls in statistical analysis: The perils of multiple testing". Perspect Clin Res. 7 (2): 106–107. doi:10.4103/2229-3485.179436. PMC 4840791. PMID 27141478.
- ↑ Hall, P. and Wilson, S.R., 1991. Two guidelines for bootstrap hypothesis testing. Biometrics, pp.757-762.
- ↑ Tibshirani, R.J. and Efron, B., 1993. An introduction to the bootstrap. Monographs on statistics and applied probability, 57(1).
- ↑ Martin, M.A., 2007. Bootstrap hypothesis testing for some common statistical problems: A critical evaluation of size and power properties. Computational Statistics & Data Analysis, 51(12), pp.6321-6342.
- ↑ Horowitz, J.L., 2019. Bootstrap methods in econometrics. Annual Review of Economics, 11, pp.193-224. I'm
- ↑ John Arbuthnot (1710). "An argument for Divine Providence, taken from the constant regularity observed in the births of both sexes" (PDF). Philosophical Transactions of the Royal Society of London. 27 (325–336): 186–190. doi:10.1098/rstl.1710.0011. S2CID 186209819.
- ↑ Brian, Éric; Jaisson, Marie (2007). "Physico-Theology and Mathematics (1710–1794)". The Descent of Human Sex Ratio at Birth. Springer Science & Business Media. pp. 1–25. ISBN 978-1-4020-6036-6.
- ↑ Conover, W.J. (1999), "Chapter 3.4: The Sign Test", Practical Nonparametric Statistics (Third ed.), Wiley, pp. 157–176, ISBN 978-0-471-16068-7
- ↑ Sprent, P. (1989), Applied Nonparametric Statistical Methods (Second ed.), Chapman & Hall, ISBN 978-0-412-44980-2
- ↑ Stigler, Stephen M. (1986). The History of Statistics: The Measurement of Uncertainty Before 1900. Harvard University Press. pp. 225–226. ISBN 978-0-67440341-3.
- ↑ Stigler, Stephen M. (1986). The History of Statistics: The Measurement of Uncertainty before 1900. Cambridge, Mass: Belknap Press of Harvard University Press. p. 134. ISBN 978-0-674-40340-6.
- ↑ Fisher, Sir Ronald A. (2000) [1935]. "Mathematics of a Lady Tasting Tea". In James Roy Newman (ed.). The World of Mathematics, volume 3 [Design of Experiments]. Courier Dover Publications. ISBN 978-0-486-41151-4. Originally from Fisher's book Design of Experiments.
- ↑ Box, Joan Fisher (1978). R.A. Fisher, The Life of a Scientist. New York: Wiley. p. 134. ISBN 978-0-471-09300-8.
- ↑ Jaynes, E. T. (2007). Probability theory: the logic of science (5. print. ed.). Cambridge [u.a.]: Cambridge Univ. Press. ISBN 978-0-521-59271-0.
- ↑ Corneliussen, Steven T. (2015-11-24). "Which scientists can winningly explain a flame, time, sleep, color, or sound to 11-year-olds?". Physics Today (11) 11792. Bibcode:2015PhT..2015k1792C. doi:10.1063/pt.5.8150. ISSN 1945-0699.
- ↑ Wasserstein, Ronald L.; Lazar, Nicole A. (2016-04-02). "The ASA Statement on p -Values: Context, Process, and Purpose". The American Statistician. 70 (2): 129–133. doi:10.1080/00031305.2016.1154108. ISSN 0003-1305. S2CID 124084622.
- ↑ Schervish, M (1996) Theory of Statistics, p. 218. Springer ISBN 0-387-94546-6
- ↑ Kaye, David H.; Freedman, David A. (2011). "Reference Guide on Statistics". Reference Manual on Scientific Evidence (3rd ed.). Eagan, MN; Washington, D.C.: West National Academies Press. p. 259. ISBN 978-0-309-21421-6.
- ↑ Ash, Robert (1970). Basic probability theory. New York: Wiley. ISBN 978-0-471-03450-6.Section 8.2
- 1 2 Tukey, John W. (1960). "Conclusions vs decisions". Technometrics. 26 (4): 423–433. doi:10.1080/00401706.1960.10489909. "Until we go through the accounts of testing hypotheses, separating [Neyman–Pearson] decision elements from [Fisher] conclusion elements, the intimate mixture of disparate elements will be a continual source of confusion." ... "There is a place for both "doing one's best" and "saying only what is certain," but it is important to know, in each instance, both which one is being done, and which one ought to be done."
- ↑ Stigler, Stephen M. (August 1996). "The History of Statistics in 1933". Statistical Science. 11 (3): 244–252. doi:10.1214/ss/1032280216. JSTOR 2246117.
- ↑ Berger, James O. (2003). "Could Fisher, Jeffreys and Neyman Have Agreed on Testing?". Statistical Science. 18 (1): 1–32. Bibcode:2003StaSc..1897485B. doi:10.1214/ss/1056397485.
- ↑ Cornfield, Jerome (1976). "Recent Methodological Contributions to Clinical Trials" (PDF). American Journal of Epidemiology. 104 (4): 408–421. doi:10.1093/oxfordjournals.aje.a112313. PMID 788503.
- ↑ Yates, Frank (1951). "The Influence of Statistical Methods for Research Workers on the Development of the Science of Statistics". Journal of the American Statistical Association. 46 (253): 19–34. doi:10.1080/01621459.1951.10500764. "The emphasis given to formal tests of significance throughout [R.A. Fisher's] Statistical Methods ... has caused scientific research workers to pay undue attention to the results of the tests of significance they perform on their data, particularly data derived from experiments, and too little to the estimates of the magnitude of the effects they are investigating." ... "The emphasis on tests of significance and the consideration of the results of each experiment in isolation, have had the unfortunate consequence that scientific workers have often regarded the execution of a test of significance on an experiment as the ultimate objective."
- ↑ Begg, Colin B.; Berlin, Jesse A. (1988). "Publication bias: a problem in interpreting medical data". Journal of the Royal Statistical Society, Series A. 151 (3): 419–463. doi:10.2307/2982993. JSTOR 2982993. S2CID 121054702.
- ↑ Meehl, Paul E. (1967). "Theory-Testing in Psychology and Physics: A Methodological Paradox" (PDF). Philosophy of Science. 34 (2): 103–115. doi:10.1086/288135. S2CID 96422880. Archived from the original (PDF) on December 3, 2013. Thirty years later, Meehl acknowledged statistical significance theory to be mathematically sound while continuing to question the default choice of null hypothesis, blaming instead the "social scientists' poor understanding of the logical relation between theory and fact" in "The Problem Is Epistemology, Not Statistics: Replace Significance Tests by Confidence Intervals and Quantify Accuracy of Risky Numerical Predictions" (Chapter 14 in Harlow (1997)).
- ↑ Bakan, David (1966). "The test of significance in psychological research". Psychological Bulletin. 66 (6): 423–437. doi:10.1037/h0020412. PMID 5974619.
- ↑ Gigerenzer, G (November 2004). "Mindless statistics". The Journal of Socio-Economics. 33 (5): 587–606. doi:10.1016/j.socec.2004.09.033. hdl:11858/00-001M-0000-0025-87C0-8.
- ↑ Nunnally, Jum (1960). "The place of statistics in psychology". Educational and Psychological Measurement. 20 (4): 641–650. doi:10.1177/001316446002000401. S2CID 144813784.
- ↑ Lykken, David T. (1991). "What's wrong with psychology, anyway?". Thinking Clearly About Psychology. 1: 3–39.
- ↑ Jacob Cohen (December 1994). "The Earth Is Round (p < .05)". American Psychologist. 49 (12): 997–1003. doi:10.1037/0003-066X.49.12.997. S2CID 380942. This paper lead to the review of statistical practices by the APA. Cohen was a member of the Task Force that did the review.
- ↑ Kline, Rex (2004). Beyond Significance Testing: Reforming Data Analysis Methods in Behavioral Research. Washington, D.C.: American Psychological Association. ISBN 978-1-59147-118-9.
- ↑ Branch, Mark (2014). "Malignant side effects of null hypothesis significance testing". Theory & Psychology. 24 (2): 256–277. doi:10.1177/0959354314525282. S2CID 40712136.
- ↑ Hunter, John E. (January 1997). "Needed: A Ban on the Significance Test". Psychological Science. 8 (1): 3–7. doi:10.1111/j.1467-9280.1997.tb00534.x. S2CID 145422959.
- ↑ Lakens, Daniël (2021). "The practical alternative to the p value is the correctly used p value". Perspectives on Psychological Science. 16 (3): 639–648. doi:10.1177/1745691620958012. PMC 8114329. S2CID 231863811.
- 1 2 Wilkinson, Leland (1999). "Statistical Methods in Psychology Journals; Guidelines and Explanations". American Psychologist. 54 (8): 594–604. Bibcode:1999AmPsy..54..594W. doi:10.1037/0003-066X.54.8.594. S2CID 428023. "Hypothesis tests. It is hard to imagine a situation in which a dichotomous accept-reject decision is better than reporting an actual p value or, better still, a confidence interval." (p 599). The committee used the cautionary term "forbearance" in describing its decision against a ban of hypothesis testing in psychology reporting. (p 603)
- ↑ "ICMJE: Obligation to Publish Negative Studies". Archived from the original on July 16, 2012. Retrieved September 3, 2012.
Editors should seriously consider for publication any carefully done study of an important question, relevant to their readers, whether the results for the primary or any additional outcome are statistically significant. Failure to submit or publish findings because of lack of statistical significance is an important cause of publication bias.
- ↑ Journal of Articles in Support of the Null Hypothesis website: JASNH homepage. Volume 1 number 1 was published in 2002, and all articles are on psychology-related subjects.
- ↑ Howell, David (2002). Statistical Methods for Psychology (5 ed.). Duxbury. p. 94. ISBN 978-0-534-37770-0.
- ↑ Williams, S.; Carson, R.; Tóth, K. (October 10, 2023). "Moving beyond P values in The Journal of Physiology: A primer on the value of effect sizes and confidence intervals". J Physiol. 601 (23): 5131–5133. doi:10.1113/JP285575. PMID 37815959. S2CID 263827430.
- ↑ P-Values are Random Variables Duncan J. Murdoch, Yu-Ling Tsai and James Adcock, The American Statistician, 2008, https://www.jstor.org/stable/27644033
- ↑ Boos, Dennis D; Stefanski, Leonard A (2011). "P-Value Precision and Reproducibility". The American Statistician. 65 (4): 213–221. doi:10.1198/tas.2011.10129. PMC 3370685. PMID 22690019.
- ↑ Ho, Joses; Tumkaya, Tayfun; Aryal, Sameer; Choi, Hyungwon; Claridge-Chang, Adam (June 19, 2019). "Moving beyond P values: data analysis with estimation graphics". Nature Methods. 16 (7): 565–566. doi:10.1038/s41592-019-0470-3. ISSN 1548-7091. PMID 31217592.
- 1 2 Kruschke, J K (July 9, 2012). "Bayesian Estimation Supersedes the T Test" (PDF). Journal of Experimental Psychology: General. 142 (2): 573–603. doi:10.1037/a0029146. PMID 22774788. S2CID 5610231.
- 1 2 Kruschke, J K (May 8, 2018). "Rejecting or Accepting Parameter Values in Bayesian Estimation" (PDF). Advances in Methods and Practices in Psychological Science. 1 (2): 270–280. doi:10.1177/2515245918771304. S2CID 125788648.
- ↑ Armstrong, J. Scott (2007). "Significance tests harm progress in forecasting". International Journal of Forecasting. 23 (2): 321–327. doi:10.1016/j.ijforecast.2007.03.004. S2CID 1550979.
- ↑ Kass, R. E. (1993). Bayes factors and model uncertainty (PDF) (Report). Department of Statistics, University of Washington.
- ↑ Rozeboom, William W (1960). "The fallacy of the null-hypothesis significance test" (PDF). Psychological Bulletin. 57 (5): 416–428. doi:10.1037/h0042040. PMID 13744252. "...the proper application of statistics to scientific inference is irrevocably committed to extensive consideration of inverse [AKA Bayesian] probabilities..." It was acknowledged, with regret, that a priori probability distributions were available "only as a subjective feel, differing from one person to the next" "in the more immediate future, at least".
- ↑ Berger, James (2006). "The Case for Objective Bayesian Analysis". Bayesian Analysis. 1 (3): 385–402. doi:10.1214/06-ba115. In listing the competing definitions of "objective" Bayesian analysis, "A major goal of statistics (indeed science) is to find a completely coherent objective Bayesian methodology for learning from data." The author expressed the view that this goal "is not attainable".
- ↑ Aldrich, J (2008). "R. A. Fisher on Bayes and Bayes' theorem". Bayesian Analysis. 3 (1): 161–170. doi:10.1214/08-BA306.
Further reading
- Adèr, H. J.; Mellenbergh, G. J. & Hand, D. J. (2007). Advising on research methods: A consultant's companion. Huizen, The Netherlands: Johannes van Kessel Publishing. ISBN 978-90-79418-01-5.
- Efron, B. (2004). "Large-Scale Simultaneous Hypothesis Testing". Journal of the American Statistical Association. 99 (465): 96–104. doi:10.1198/016214504000000089. S2CID 1520711. The application of significance testing in this paper is an outlier. Tests to find a null hypothesis? Not trying to show significance, but to find interesting cases?
- Lehmann E.L. (1992) "Introduction to Neyman and Pearson (1933) On the Problem of the Most Efficient Tests of Statistical Hypotheses". In: Breakthroughs in Statistics, Volume 1, (Eds Kotz, S., Johnson, N.L.), Springer-Verlag. ISBN 0-387-94037-5 (followed by reprinting of the paper)
- Neyman, J.; Pearson, E.S. (1933). "On the Problem of the Most Efficient Tests of Statistical Hypotheses". Philosophical Transactions of the Royal Society A. 231 (694–706): 289–337. Bibcode:1933RSPTA.231..289N. doi:10.1098/rsta.1933.0009.
- Rice, William R.; Gaines, Steven D. (June 1994). "'Heads I win, tails you lose': testing directional alternative hypotheses in ecological and evolutionary research". TREE. 9 (6): 235–237. Bibcode:1994TEcoE...9..235R. doi:10.1016/0169-5347(94)90258-5. PMID 21236837. Directed tests combine the attributes of one-tailed and two-tailed tests. "...directed tests should be used in virtually all applications where one-sided tests have previously been used, excepting those cases where the data can only deviate from H0, in one direction."
External links

- "Statistical hypotheses, verification of", Encyclopedia of Mathematics, EMS Press, 2001 [1994]
- Bayesian critique of classical hypothesis testing
- Critique of classical hypothesis testing highlighting long-standing qualms of statisticians
- Statistical Tests Overview: How to choose the correct statistical test
- Statistical Analysis based Hypothesis Testing Method in Biological Knowledge Discovery; Md. Naseef-Ur-Rahman Chowdhury, Suvankar Paul, Kazi Zakia Sultana
- HyperStat Online: Null hypothesis
Online calculators


| General |
| ||||||
|---|---|---|---|---|---|---|---|
| Preventive healthcare |
| ||||||
| Population health | |||||||
| Biological and epidemiological statistics | |||||||
| Infectious and epidemic disease prevention | |||||||
| Food hygiene and safety management | |||||||
| Health behavioral sciences | |||||||
| Organizations, education and history |
| ||||||
| International | |
|---|---|
| National | |
| Other | |
